 1
 2
 3
 4
 5
 6
 7
 8
 9
10
11
12
13
14
15
16
17
18
19
20
21
22
23
24
25
26
27
28
29
30
31
32
33
34
35
36
37
38
39
40
41
42
43
44
45
46
47
48
49
50
51
52
53
54
55
56
57
58
59
60
61
62
63
64
65
66
67
68
69
70
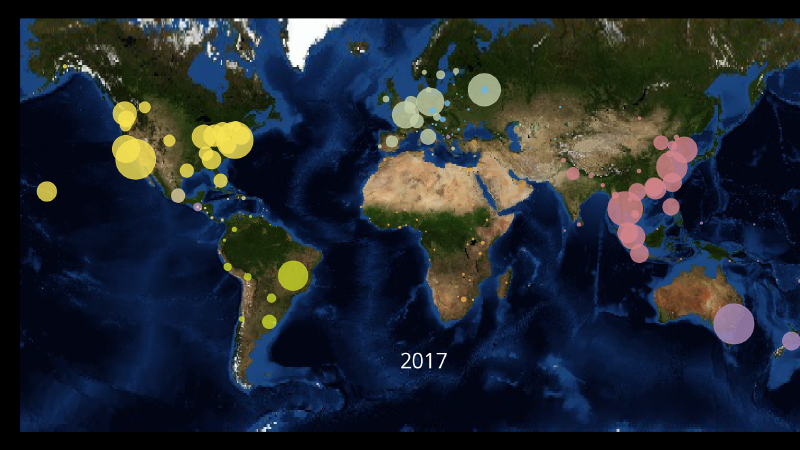
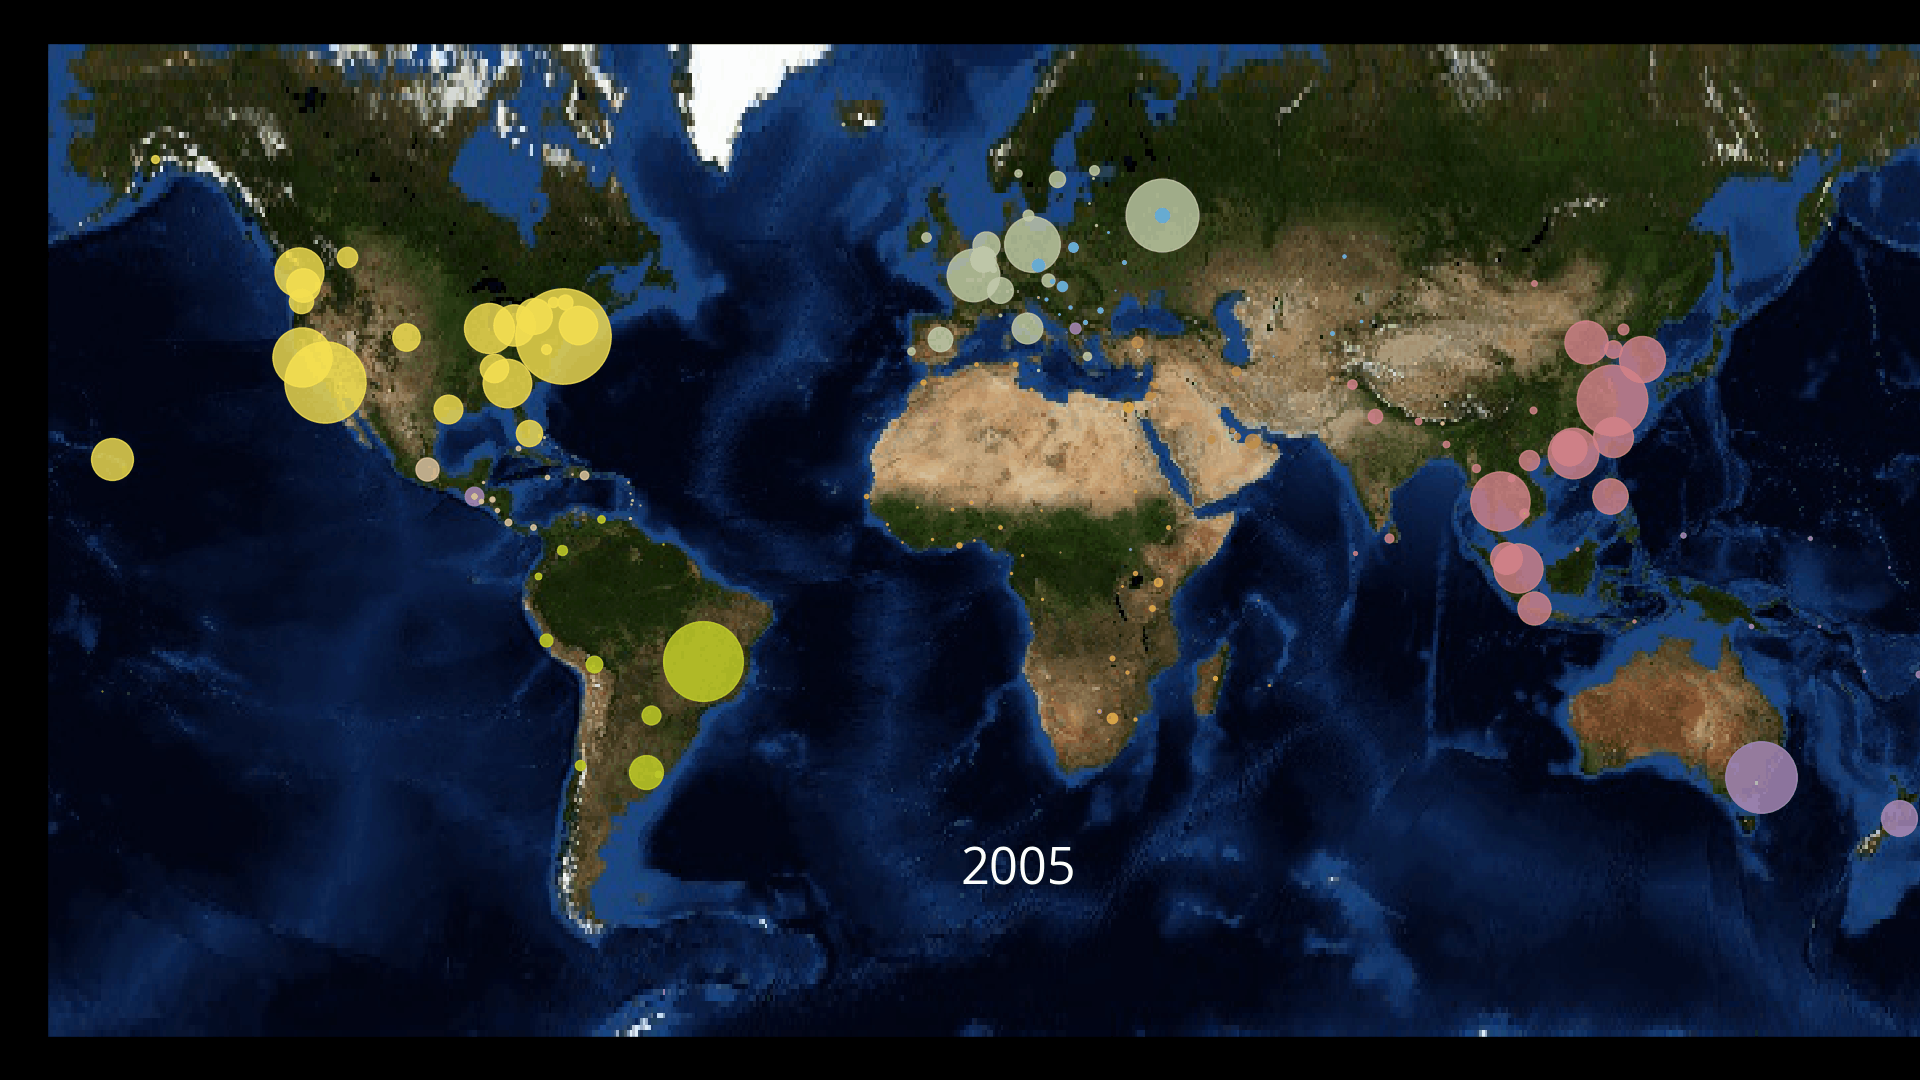
| def create_national_map():
fontname = 'Open Sans'
fontsize = 28
year_x = 0
year_y = -50
start_year = 2002
end_year = 2017
df = pd.read_excel('NationalsOverseasData.xlsx','data',header=0)
print(df.head())
os.environ['CARTOPY_USER_BACKGROUNDS'] = const.FOLDER_CARTOPYBG
fig = plt.figure(figsize=(19.2, 10.8))
ax = plt.axes(projection=ccrs.Mercator(central_longitude=0,
min_latitude=-65,
max_latitude=70))
for year in range(start_year ,end_year+1):
ax = make_map_plot(year, df, ax=ax, resolution='low')
# Date text
ax.text(year_x, year_y,
f"{year:04d}",
color='white',
fontname=fontname, fontsize=fontsize*1.3,
transform=ccrs.PlateCarree())
fig.tight_layout(pad=-0.5)
fig.savefig(f"frames/frame_{year:04d}.png", dpi=100,
frameon=False, facecolor='black')
ax.clear()
def make_map_plot(year, df , ax=None, resolution='low'):
if ax is None:
fig = plt.figure(figsize=(19.2, 10.8))
ax = plt.axes(projection=ccrs.Mercator(min_latitude=-65,
max_latitude=70))
ax.background_img(name='BM', resolution=resolution)
ax.set_extent([-170, 179, -65, 70], crs=ccrs.PlateCarree())
# http://www.hp-stylelink.com/news/2013/07/20130708.php
colors = {
'Ⅰ アジア': '#d5848b',
'Ⅱ 大洋州': '#ae8dbc' ,
'Ⅲ 北米': '#f8e352',
'Ⅳ 中米': '#e1cea3',
'Ⅴ 南米': '#c8d627',
'Ⅵ 西欧': '#c3cfa9',
'Ⅶ 東欧・旧ソ連': '#66b7ec',
'Ⅷ 中東': '#c08e47',
'Ⅸ アフリカ': '#e5ab47',
'Ⅹ 南極': '#7b9ad0',
}
for index, row in df.iterrows():
area = row['Area']
longs = row['lon']
lats = row['lat']
sizes = row[year]/20
ax.scatter(longs, lats, s=sizes,
color=colors[area], alpha=0.8,
transform=ccrs.PlateCarree())
return ax
|